Eurocup · 2024-25 · Temporada regular · Martes 12 de noviembre de 2024

Local
Trefl Sopot
64–93
Visitante
Hapoel Shlomo Tel Aviv
Final
Lleva la cuenta de los partidos que ves y oculta los resultados que aún no quieres saber.
Entrar
Por cuartos
| Equipo | 1.º | 2.º | 3.º | 4.º | Total |
|---|---|---|---|---|---|
| Trefl Sopot | 16 | 16 | 18 | 14 | 64 |
| Hapoel Shlomo Tel Aviv | 22 | 23 | 22 | 26 | 93 |
Ergo Arena · 1.531 espectadores
Comparativa
| Trefl Sopot | Estadística | Hapoel Shlomo Tel Aviv |
|---|---|---|
| 21-60 · 35,0 % | Tiros de campo | 34-65 · 52,3 % |
| 6-28 | Triples | 10-26 |
| 16-17 | Tiros libres | 15-18 |
| 29 (7-22) | Rebotes (of.-def.) | 39 (11-28) |
| 13 | Asistencias | 20 |
| 4 · 0 | Robos · tapones | 10 · 3 |
| 17 · 19 | Pérdidas · faltas | 11 · 19 |
| Avanzadas (propias) | ||
| 73,8 | Posesiones | 73,8 |
| 73,8 | Ritmo | 73,8 |
| 86,7 | Eficiencia ofensiva | 126,0 |
| 126,0 | Eficiencia defensiva | 86,7 |
| 40,0 % | eFG % | 60,0 % |
| 47,4 % | TS % | 63,8 % |
| 20,1 % | % de pérdidas | 13,1 % |
| 20,0 % | % rebote ofensivo | 33,3 % |
| 0,267 | Tiros libres / tiros de campo | 0,231 |
Trefl Sopot
| Jugador | Min | Pts | Reb | Ast | Rob | Tap | Pér | Fal | TC | T3 | TL | RO-RD | +/− |
|---|---|---|---|---|---|---|---|---|---|---|---|---|---|
| TP Tarik Phillip T | 37:12 | 9 | 4 | 4 | 4 | 0 | 3 | 2 | 3-9 | 1-4 | 2-3 | 0-4 | −28 |
| AB Aaron Best T | 35:08 | 10 | 0 | 2 | 0 | 0 | 3 | 2 | 4-9 | 1-5 | 1-1 | 0-0 | −27 |
| JZ Jaroslaw Zyskowski T | 23:18 | 5 | 1 | 1 | 0 | 0 | 1 | 1 | 2-3 | 1-2 | 0-0 | 0-1 | −18 |
| MW Mikolaj Witlinski T | 19:12 | 4 | 2 | 0 | 0 | 0 | 2 | 2 | 2-4 | 0-0 | 0-0 | 2-0 | −4 |
| RM Robert Mcgowens T | 17:10 | 6 | 6 | 1 | 0 | 0 | 1 | 2 | 2-8 | 0-3 | 2-2 | 0-6 | −9 |
| JS Jakub Schenk | 26:24 | 17 | 3 | 2 | 0 | 0 | 4 | 5 | 3-12 | 2-7 | 9-9 | 0-3 | −14 |
| MW Marcus Weathers | 19:17 | 9 | 7 | 1 | 0 | 0 | 1 | 0 | 3-7 | 1-3 | 2-2 | 4-3 | −17 |
| AV Andy Van Vliet | 18:13 | 4 | 2 | 2 | 0 | 0 | 1 | 4 | 2-7 | 0-3 | 0-0 | 0-2 | −19 |
| BJ Bartosz Jankowski | 4:06 | 0 | 0 | 0 | 0 | 0 | 0 | 1 | 0-1 | 0-1 | 0-0 | 0-0 | −9 |
| Equipo | 64 | 29 | 13 | 4 | 0 | 17 | 19 | 21-60 | 6-28 | 16-17 | 7-22 |
| Jugador | eFG % | TS % | Uso % | Ast % | Reb % | Pér % | Rob % | Tap % | PIE | Val |
|---|---|---|---|---|---|---|---|---|---|---|
| TP Tarik Phillip | 38,9 % | 43,6 % | 17,0 % | 24,2 % | 6,3 % | 22,5 % | 5,8 % | 0,0 % | 7,2 % | 15 |
| AB Aaron Best | 50,0 % | 53,0 % | 16,8 % | 13,9 % | 0,0 % | 24,1 % | 0,0 % | 0,0 % | 1,6 % | 3 |
| JZ Jaroslaw Zyskowski | 83,3 % | 83,3 % | 8,1 % | 9,8 % | 2,5 % | 25,0 % | 0,0 % | 0,0 % | 3,2 % | 4 |
| MW Mikolaj Witlinski | 50,0 % | 50,0 % | 14,8 % | 0,0 % | 6,1 % | 33,3 % | 0,0 % | 0,0 % | -0,8 % | 1 |
| RM Robert Mcgowens | 25,0 % | 33,8 % | 27,3 % | 14,3 % | 20,6 % | 10,1 % | 0,0 % | 0,0 % | 3,2 % | 6 |
| JS Jakub Schenk | 33,3 % | 53,3 % | 35,8 % | 18,4 % | 6,7 % | 20,0 % | 0,0 % | 0,0 % | 3,2 % | 10 |
| MW Marcus Weathers | 50,0 % | 57,1 % | 21,8 % | 14,0 % | 21,4 % | 11,3 % | 0,0 % | 0,0 % | 8,0 % | 13 |
| AV Andy Van Vliet | 28,6 % | 28,6 % | 20,8 % | 26,4 % | 6,5 % | 12,5 % | 0,0 % | 0,0 % | -1,6 % | -3 |
| BJ Bartosz Jankowski | 0,0 % | 0,0 % | 11,6 % | 0,0 % | 0,0 % | 0,0 % | 0,0 % | 0,0 % | -1,6 % | -2 |
Calculadas por Estadísticasdeportes a partir del box score (fórmulas v1). «—»: no significativo con tan pocos minutos.
Hapoel Shlomo Tel Aviv
| Jugador | Min | Pts | Reb | Ast | Rob | Tap | Pér | Fal | TC | T3 | TL | RO-RD | +/− |
|---|---|---|---|---|---|---|---|---|---|---|---|---|---|
 Bruno Caboclo T |
30:43 | 10 | 6 | 3 | 2 | 0 | 1 | 2 | 4-9 | 0-2 | 2-2 | 2-4 | +17 |
| TG Tomer Ginat T | 27:02 | 14 | 2 | 0 | 1 | 0 | 0 | 1 | 5-10 | 1-2 | 3-4 | 1-1 | +10 |
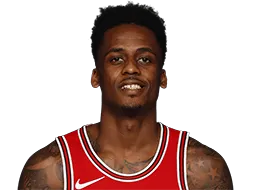 Antonio Blakeney T |
21:47 | 12 | 4 | 2 | 0 | 0 | 2 | 0 | 4-7 | 0-1 | 4-5 | 1-3 | +14 |
 Patrick Beverley T |
20:33 | 11 | 4 | 3 | 0 | 0 | 1 | 2 | 4-8 | 3-6 | 0-0 | 1-3 | +6 |
| NY Noam Yaacov T | 15:39 | 2 | 1 | 5 | 3 | 0 | 1 | 3 | 1-2 | 0-1 | 0-0 | 0-1 | +4 |
| MF Marcus Foster | 22:24 | 21 | 8 | 1 | 0 | 0 | 2 | 2 | 7-10 | 3-6 | 4-4 | 2-6 | +17 |
| JR Joe Ragland | 19:07 | 6 | 2 | 4 | 2 | 0 | 1 | 3 | 2-6 | 1-2 | 1-1 | 1-1 | +22 |
| BT Bar Timor | 16:40 | 2 | 3 | 2 | 1 | 0 | 1 | 1 | 1-4 | 0-2 | 0-0 | 0-3 | +14 |
 Ish Wainright |
14:05 | 8 | 2 | 0 | 0 | 2 | 0 | 2 | 3-6 | 1-3 | 1-2 | 1-1 | +17 |
| OB Oz Blayzer | 7:46 | 4 | 1 | 0 | 1 | 1 | 1 | 3 | 2-2 | 0-0 | 0-0 | 1-0 | +11 |
| GP Guy Palatin | 3:10 | 3 | 1 | 0 | 0 | 0 | 0 | 0 | 1-1 | 1-1 | 0-0 | 0-1 | +8 |
| MR Miron Ruina | 1:04 | 0 | 0 | 0 | 0 | 0 | 0 | 0 | 0-0 | 0-0 | 0-0 | 0-0 | +5 |
| Equipo | 93 | 39 | 20 | 10 | 3 | 11 | 19 | 34-65 | 10-26 | 15-18 | 11-28 |
| Jugador | eFG % | TS % | Uso % | Ast % | Reb % | Pér % | Rob % | Tap % | PIE | Val |
|---|---|---|---|---|---|---|---|---|---|---|
|
Bruno Caboclo |
44,4 % | 50,6 % | 16,9 % | 13,6 % | 11,5 % | 9,2 % | 3,5 % | 0,0 % | 9,6 % | 16 |
| TG Tomer Ginat | 55,0 % | 59,5 % | 20,7 % | 0,0 % | 4,4 % | 0,0 % | 2,0 % | 0,0 % | 7,6 % | 12 |
|
Antonio Blakeney |
57,1 % | 65,2 % | 24,5 % | 13,8 % | 10,8 % | 17,9 % | 0,0 % | 0,0 % | 9,2 % | 16 |
|
Patrick Beverley |
68,8 % | 68,8 % | 20,9 % | 22,3 % | 11,5 % | 11,1 % | 0,0 % | 0,0 % | 8,4 % | 11 |
| NY Noam Yaacov | 50,0 % | 50,0 % | 9,1 % | 40,6 % | 3,8 % | 33,3 % | 10,4 % | 0,0 % | 4,8 % | 7 |
| MF Marcus Foster | 85,0 % | 89,3 % | 29,3 % | 8,3 % | 21,0 % | 14,5 % | 0,0 % | 0,0 % | 17,7 % | 25 |
| JR Joe Ragland | 41,7 % | 46,6 % | 18,6 % | 28,1 % | 6,2 % | 13,4 % | 5,7 % | 0,0 % | 4,4 % | 8 |
| BT Bar Timor | 25,0 % | 25,0 % | 14,3 % | 15,2 % | 10,6 % | 20,0 % | 3,3 % | 0,0 % | 2,4 % | 4 |
|
Ish Wainright |
58,3 % | 58,1 % | 23,3 % | 0,0 % | 8,4 % | 0,0 % | 0,0 % | 17,8 % | 3,6 % | 9 |
| OB Oz Blayzer | 100,0 % | 100,0 % | 18,4 % | 0,0 % | 7,6 % | 33,3 % | 7,0 % | 16,1 % | 1,6 % | 4 |
| GP Guy Palatin | 150,0 % | 150,0 % | 15,1 % | 0,0 % | 18,6 % | 0,0 % | 0,0 % | 0,0 % | 3,2 % | 4 |
| MR Miron Ruina | — | — | 0,0 % | 0,0 % | 0,0 % | — | 0,0 % | 0,0 % | 0,0 % | 0 |
Calculadas por Estadísticasdeportes a partir del box score (fórmulas v1). «—»: no significativo con tan pocos minutos.
Calendario, resultados y estadísticas básicas de Euroleague Basketball; avanzadas calculadas por Estadísticasdeportes.