NBA · 2000-01 · Temporada regular · Miércoles 11 de abril de 2001

Local
Detroit Pistons
99–87

Visitante
Toronto Raptors
Final
Lleva la cuenta de los partidos que ves y oculta los resultados que aún no quieres saber.
Entrar
Comparativa
| Detroit Pistons | Estadística | Toronto Raptors |
|---|---|---|
| 37-84 · 44,0 % | Tiros de campo | 36-92 · 39,1 % |
| 4-18 | Triples | 5-15 |
| 21-28 | Tiros libres | 10-13 |
| 46 (10-36) | Rebotes (of.-def.) | 52 (16-36) |
| 26 | Asistencias | 22 |
| 11 · 6 | Robos · tapones | 8 · 4 |
| 13 · 19 | Pérdidas · faltas | 18 · 26 |
| Avanzadas (propias) | ||
| 97,0 | Posesiones | 97,0 |
| 97,0 | Ritmo | 97,0 |
| 102,1 | Eficiencia ofensiva | 89,7 |
| 89,7 | Eficiencia defensiva | 102,1 |
| 46,4 % | eFG % | 41,9 % |
| 51,4 % | TS % | 44,5 % |
| 11,9 % | % de pérdidas | 15,6 % |
| 21,7 % | % rebote ofensivo | 30,8 % |
| 0,250 | Tiros libres / tiros de campo | 0,109 |
Detroit Pistons
| Jugador | Min | Pts | Reb | Ast | Rob | Tap | Pér | Fal | TC | T3 | TL | RO-RD | +/− |
|---|---|---|---|---|---|---|---|---|---|---|---|---|---|
 Jerry Stackhouse |
45:00 | 35 | 2 | 6 | 0 | 2 | 3 | 0 | 11-32 | 4-13 | 9-9 | 2-0 | +12 |
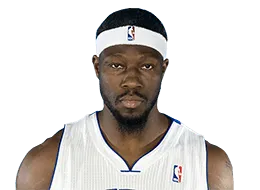 Ben Wallace |
41:00 | 6 | 23 | 3 | 0 | 4 | 1 | 1 | 3-5 | 0-0 | 0-1 | 3-20 | +24 |
 Corliss Williamson |
35:00 | 23 | 7 | 1 | 1 | 0 | 0 | 5 | 10-15 | 0-0 | 3-4 | 2-5 | +11 |
 Chucky Atkins |
31:00 | 5 | 1 | 7 | 1 | 0 | 1 | 1 | 0-9 | 0-3 | 5-8 | 0-1 | +14 |
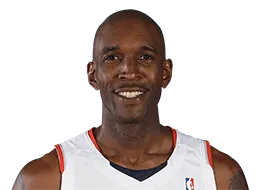 Joe Smith |
25:00 | 10 | 3 | 2 | 2 | 0 | 2 | 5 | 5-8 | 0-0 | 0-0 | 1-2 | −5 |
 Mateen Cleaves |
18:00 | 5 | 4 | 3 | 3 | 0 | 2 | 1 | 2-7 | 0-0 | 1-2 | 0-4 | −4 |
 Brian Cardinal |
18:00 | 9 | 4 | 1 | 3 | 0 | 0 | 2 | 3-4 | 0-1 | 3-4 | 1-3 | +13 |
 Mikki Moore |
11:00 | 2 | 1 | 1 | 1 | 0 | 2 | 2 | 1-1 | 0-0 | 0-0 | 1-0 | −8 |
| JB Jud Buechler | 8:00 | 2 | 0 | 1 | 0 | 0 | 0 | 1 | 1-2 | 0-1 | 0-0 | 0-0 | +15 |
 Kornel David |
7:00 | 2 | 1 | 1 | 0 | 0 | 1 | 1 | 1-1 | 0-0 | 0-0 | 0-1 | −12 |
| Equipo | 99 | 46 | 26 | 11 | 6 | 13 | 19 | 37-84 | 4-18 | 21-28 | 10-36 |
| Jugador | eFG % | TS % | Uso % | Ast % | Reb % | Pér % | Rob % | Tap % | PIE | Val |
|---|---|---|---|---|---|---|---|---|---|---|
|
Jerry Stackhouse |
40,6 % | 48,7 % | 38,0 % | 25,3 % | 2,2 % | 7,7 % | 0,0 % | 2,8 % | 12,3 % | 21 |
|
Ben Wallace |
60,0 % | 55,2 % | 6,9 % | 10,5 % | 27,5 % | 15,5 % | 0,0 % | 6,1 % | 17,9 % | 32 |
|
Corliss Williamson |
66,7 % | 68,6 % | 21,0 % | 5,9 % | 9,8 % | 0,0 % | 1,4 % | 0,0 % | 13,0 % | 26 |
|
Chucky Atkins |
0,0 % | 20,0 % | 19,2 % | 29,3 % | 1,6 % | 7,4 % | 1,6 % | 0,0 % | 0,0 % | 1 |
|
Joe Smith |
62,5 % | 62,5 % | 17,6 % | 14,0 % | 5,9 % | 20,0 % | 4,0 % | 0,0 % | 4,2 % | 12 |
|
Mateen Cleaves |
28,6 % | 31,7 % | 24,1 % | 25,3 % | 10,9 % | 20,2 % | 8,3 % | 0,0 % | 3,9 % | 7 |
|
Brian Cardinal |
75,0 % | 78,1 % | 14,1 % | 9,2 % | 10,9 % | 0,0 % | 8,3 % | 0,0 % | 8,1 % | 15 |
|
Mikki Moore |
100,0 % | 100,0 % | 12,0 % | 13,4 % | 4,5 % | 66,7 % | 4,5 % | 0,0 % | 0,3 % | 3 |
| JB Jud Buechler | 50,0 % | 50,0 % | 11,0 % | 19,4 % | 0,0 % | 0,0 % | 0,0 % | 0,0 % | 0,7 % | 2 |
|
Kornel David |
100,0 % | 100,0 % | 12,6 % | 22,8 % | 7,0 % | 50,0 % | 0,0 % | 0,0 % | 1,3 % | 3 |
Calculadas por Estadísticasdeportes a partir del box score (fórmulas v1). «—»: no significativo con tan pocos minutos.
Toronto Raptors
| Jugador | Min | Pts | Reb | Ast | Rob | Tap | Pér | Fal | TC | T3 | TL | RO-RD | +/− |
|---|---|---|---|---|---|---|---|---|---|---|---|---|---|
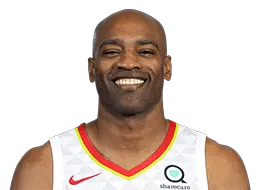 Vince Carter |
46:00 | 22 | 5 | 1 | 2 | 0 | 4 | 3 | 8-25 | 3-7 | 3-4 | 3-2 | −17 |
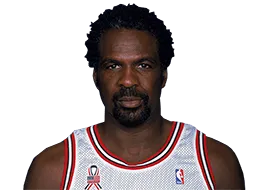 Charles Oakley |
39:00 | 10 | 11 | 2 | 0 | 0 | 2 | 3 | 5-14 | 0-0 | 0-0 | 1-10 | −4 |
 Alvin Williams |
35:00 | 15 | 3 | 11 | 2 | 0 | 2 | 2 | 6-14 | 0-2 | 3-4 | 1-2 | −12 |
 Antonio Davis |
31:00 | 7 | 13 | 1 | 1 | 2 | 3 | 2 | 2-14 | 0-0 | 3-4 | 3-10 | −17 |
 Jerome Williams |
23:00 | 13 | 6 | 1 | 0 | 1 | 2 | 5 | 6-7 | 0-0 | 1-1 | 3-3 | +9 |
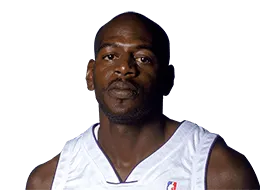 Keon Clark |
23:00 | 10 | 8 | 2 | 1 | 1 | 1 | 2 | 5-6 | 0-0 | 0-0 | 2-6 | −1 |
| CC Chris Childs | 17:00 | 2 | 1 | 3 | 1 | 0 | 2 | 5 | 1-2 | 0-0 | 0-0 | 0-1 | +1 |
 Morris Peterson |
13:00 | 5 | 2 | 0 | 0 | 0 | 1 | 3 | 2-4 | 1-1 | 0-0 | 1-1 | −2 |
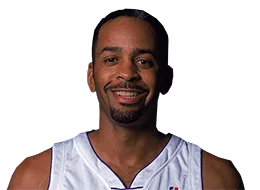 Dell Curry |
8:00 | 0 | 1 | 1 | 1 | 0 | 0 | 0 | 0-3 | 0-2 | 0-0 | 0-1 | −14 |
| TM Tracy Murray | 5:00 | 3 | 2 | 0 | 0 | 0 | 1 | 1 | 1-3 | 1-3 | 0-0 | 2-0 | −3 |
| Equipo | 87 | 52 | 22 | 8 | 4 | 18 | 26 | 36-92 | 5-15 | 10-13 | 16-36 |
| Jugador | eFG % | TS % | Uso % | Ast % | Reb % | Pér % | Rob % | Tap % | PIE | Val |
|---|---|---|---|---|---|---|---|---|---|---|
|
Vince Carter |
38,0 % | 41,1 % | 27,7 % | 3,8 % | 5,3 % | 13,0 % | 2,2 % | 0,0 % | 2,3 % | 8 |
|
Charles Oakley |
35,7 % | 35,7 % | 17,0 % | 8,3 % | 13,8 % | 12,5 % | 0,0 % | 0,0 % | 5,5 % | 12 |
|
Alvin Williams |
42,9 % | 47,6 % | 21,1 % | 54,3 % | 4,2 % | 11,3 % | 2,8 % | 0,0 % | 11,4 % | 20 |
|
Antonio Davis |
14,3 % | 22,2 % | 25,1 % | 4,7 % | 20,5 % | 16,0 % | 1,6 % | 4,7 % | 2,3 % | 8 |
|
Jerome Williams |
85,7 % | 87,4 % | 17,0 % | 8,9 % | 12,8 % | 21,2 % | 0,0 % | 3,2 % | 7,1 % | 18 |
|
Keon Clark |
83,3 % | 83,3 % | 12,6 % | 16,3 % | 17,0 % | 14,3 % | 2,2 % | 3,2 % | 10,7 % | 20 |
| CC Chris Childs | 50,0 % | 50,0 % | 9,8 % | 25,5 % | 2,9 % | 50,0 % | 2,9 % | 0,0 % | -0,7 % | 4 |
|
Morris Peterson |
62,5 % | 62,5 % | 16,0 % | 0,0 % | 7,5 % | 20,0 % | 0,0 % | 0,0 % | 0,3 % | 4 |
|
Dell Curry |
0,0 % | 0,0 % | 15,6 % | 16,7 % | 6,1 % | 0,0 % | 6,2 % | 0,0 % | 0,0 % | 0 |
| TM Tracy Murray | 50,0 % | 50,0 % | 33,2 % | 0,0 % | 19,6 % | 25,0 % | 0,0 % | 0,0 % | 0,0 % | 2 |
Calculadas por Estadísticasdeportes a partir del box score (fórmulas v1). «—»: no significativo con tan pocos minutos.
Estadísticas básicas y avanzadas oficiales de NBA.com; avanzadas propias calculadas por Estadísticasdeportes.