NBA · 2005-06 · Temporada regular · Miércoles 30 de noviembre de 2005

Local
Denver Nuggets
95–102
Visitante
New Orleans/Oklahoma City Hornets
Final
Lleva la cuenta de los partidos que ves y oculta los resultados que aún no quieres saber.
Entrar
Comparativa
| Denver Nuggets | Estadística | New Orleans/Oklahoma City Hornets |
|---|---|---|
| 38-87 · 43,7 % | Tiros de campo | 36-86 · 41,9 % |
| 5-11 | Triples | 6-9 |
| 14-20 | Tiros libres | 24-29 |
| 47 (12-35) | Rebotes (of.-def.) | 46 (12-34) |
| 23 | Asistencias | 22 |
| 6 · 12 | Robos · tapones | 7 · 7 |
| 10 · 23 | Pérdidas · faltas | 11 · 16 |
| Avanzadas (propias) | ||
| 93,1 | Posesiones | 93,1 |
| 93,1 | Ritmo | 93,1 |
| 102,0 | Eficiencia ofensiva | 109,6 |
| 109,6 | Eficiencia defensiva | 102,0 |
| 46,6 % | eFG % | 45,4 % |
| 49,6 % | TS % | 51,6 % |
| 9,5 % | % de pérdidas | 10,0 % |
| 26,1 % | % rebote ofensivo | 25,5 % |
| 0,161 | Tiros libres / tiros de campo | 0,279 |
Denver Nuggets
| Jugador | Min | Pts | Reb | Ast | Rob | Tap | Pér | Fal | TC | T3 | TL | RO-RD | +/− |
|---|---|---|---|---|---|---|---|---|---|---|---|---|---|
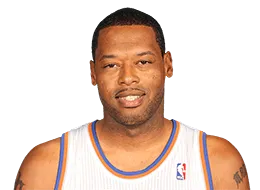 Marcus Camby |
39:00 | 16 | 16 | 1 | 2 | 8 | 2 | 4 | 7-17 | 0-0 | 2-2 | 1-15 | −6 |
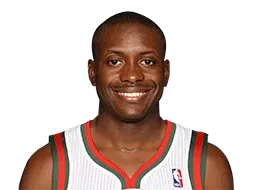 Earl Boykins |
36:00 | 9 | 3 | 12 | 1 | 0 | 2 | 3 | 3-9 | 1-2 | 2-3 | 2-1 | −11 |
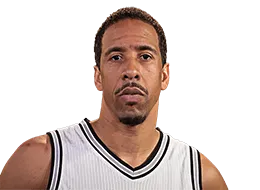 Andre Miller |
34:00 | 33 | 5 | 5 | 1 | 2 | 0 | 2 | 12-18 | 1-2 | 8-11 | 2-3 | −10 |
 Earl Watson |
28:00 | 8 | 2 | 1 | 0 | 0 | 2 | 3 | 3-9 | 2-4 | 0-0 | 0-2 | −1 |
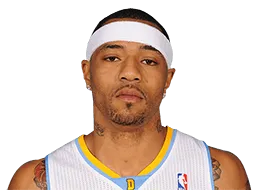 Kenyon Martin |
26:00 | 4 | 6 | 2 | 0 | 0 | 0 | 3 | 2-9 | 0-0 | 0-0 | 2-4 | +4 |
 DerMarr Johnson |
20:00 | 8 | 3 | 1 | 2 | 0 | 1 | 1 | 4-7 | 0-1 | 0-0 | 1-2 | −6 |
 Linas Kleiza |
19:00 | 7 | 6 | 0 | 0 | 0 | 1 | 2 | 3-7 | 0-0 | 1-2 | 2-4 | +6 |
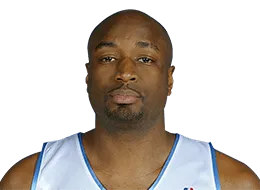 Voshon Lenard |
13:00 | 5 | 2 | 1 | 0 | 0 | 0 | 0 | 2-6 | 1-2 | 0-0 | 0-2 | +3 |
 Eduardo Najera |
13:00 | 1 | 3 | 0 | 0 | 1 | 2 | 3 | 0-2 | 0-0 | 1-2 | 1-2 | −11 |
 Francisco Elson |
12:00 | 4 | 1 | 0 | 0 | 1 | 0 | 2 | 2-3 | 0-0 | 0-0 | 1-0 | −3 |
| Equipo | 95 | 47 | 23 | 6 | 12 | 10 | 23 | 38-87 | 5-11 | 14-20 | 12-35 |
| Jugador | eFG % | TS % | Uso % | Ast % | Reb % | Pér % | Rob % | Tap % | PIE | Val |
|---|---|---|---|---|---|---|---|---|---|---|
|
Marcus Camby |
41,2 % | 44,7 % | 23,1 % | 4,2 % | 21,2 % | 10,1 % | 2,6 % | 12,8 % | 12,8 % | 31 |
|
Earl Boykins |
38,9 % | 43,6 % | 15,5 % | 47,1 % | 4,3 % | 16,2 % | 1,4 % | 0,0 % | 6,8 % | 16 |
|
Andre Miller |
69,4 % | 72,2 % | 30,5 % | 33,5 % | 7,6 % | 0,0 % | 1,5 % | 3,7 % | 18,8 % | 37 |
|
Earl Watson |
44,4 % | 44,4 % | 17,8 % | 5,2 % | 3,7 % | 18,2 % | 0,0 % | 0,0 % | 0,0 % | 3 |
|
Kenyon Martin |
22,2 % | 22,2 % | 15,7 % | 10,8 % | 11,9 % | 0,0 % | 0,0 % | 0,0 % | 0,6 % | 5 |
|
DerMarr Johnson |
57,1 % | 57,1 % | 18,2 % | 8,5 % | 7,7 % | 12,5 % | 5,2 % | 0,0 % | 4,8 % | 10 |
|
Linas Kleiza |
42,9 % | 44,4 % | 21,2 % | 0,0 % | 16,3 % | 11,3 % | 0,0 % | 0,0 % | 2,3 % | 7 |
|
Voshon Lenard |
41,7 % | 41,7 % | 20,9 % | 12,1 % | 7,9 % | 0,0 % | 0,0 % | 0,0 % | 2,3 % | 4 |
|
Eduardo Najera |
0,0 % | 17,4 % | 17,0 % | 0,0 % | 11,9 % | 41,0 % | 0,0 % | 4,8 % | -2,3 % | 0 |
|
Francisco Elson |
66,7 % | 66,7 % | 11,3 % | 0,0 % | 4,3 % | 0,0 % | 0,0 % | 5,2 % | 1,1 % | 5 |
Calculadas por Estadísticasdeportes a partir del box score (fórmulas v1). «—»: no significativo con tan pocos minutos.
New Orleans/Oklahoma City Hornets
| Jugador | Min | Pts | Reb | Ast | Rob | Tap | Pér | Fal | TC | T3 | TL | RO-RD | +/− |
|---|---|---|---|---|---|---|---|---|---|---|---|---|---|
 Desmond Mason |
40:00 | 26 | 7 | 1 | 0 | 1 | 2 | 1 | 10-17 | 0-0 | 6-8 | 3-4 | +11 |
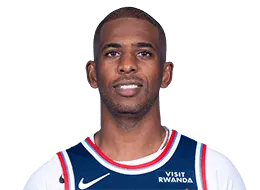 Chris Paul |
39:00 | 10 | 8 | 9 | 2 | 0 | 3 | 3 | 3-10 | 1-1 | 3-4 | 1-7 | +7 |
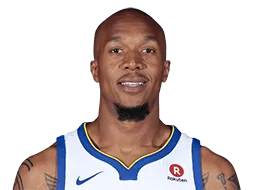 David West |
37:00 | 8 | 7 | 0 | 0 | 0 | 1 | 1 | 3-14 | 0-0 | 2-2 | 2-5 | 0 |
| PB P.J. Brown | 36:00 | 10 | 12 | 0 | 0 | 3 | 1 | 2 | 3-9 | 0-0 | 4-5 | 3-9 | +8 |
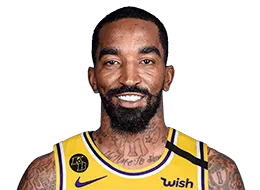 JR Smith |
33:00 | 16 | 5 | 5 | 2 | 0 | 2 | 3 | 6-13 | 4-6 | 0-0 | 1-4 | −3 |
 Speedy Claxton |
24:00 | 19 | 1 | 6 | 2 | 1 | 0 | 4 | 5-9 | 0-0 | 9-10 | 0-1 | +10 |
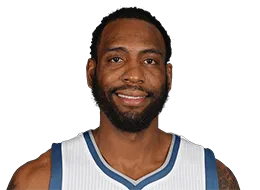 Rasual Butler |
20:00 | 11 | 4 | 1 | 1 | 1 | 0 | 1 | 5-8 | 1-2 | 0-0 | 1-3 | +1 |
 Chris Andersen |
8:00 | 2 | 1 | 0 | 0 | 1 | 0 | 0 | 1-4 | 0-0 | 0-0 | 1-0 | +1 |
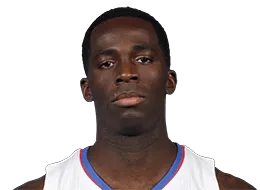 Brandon Bass |
3:00 | 0 | 1 | 0 | 0 | 0 | 0 | 1 | 0-2 | 0-0 | 0-0 | 0-1 | 0 |
| Equipo | 102 | 46 | 22 | 7 | 7 | 11 | 16 | 36-86 | 6-9 | 24-29 | 12-34 |
| Jugador | eFG % | TS % | Uso % | Ast % | Reb % | Pér % | Rob % | Tap % | PIE | Val |
|---|---|---|---|---|---|---|---|---|---|---|
|
Desmond Mason |
58,8 % | 63,4 % | 24,6 % | 5,0 % | 9,0 % | 8,9 % | 0,0 % | 1,6 % | 12,0 % | 24 |
|
Chris Paul |
35,0 % | 42,5 % | 16,6 % | 34,3 % | 10,6 % | 20,3 % | 2,6 % | 0,0 % | 8,3 % | 18 |
|
David West |
21,4 % | 26,9 % | 18,8 % | 0,0 % | 9,8 % | 6,3 % | 0,0 % | 0,0 % | 0,6 % | 3 |
| PB P.J. Brown | 33,3 % | 44,6 % | 14,8 % | 0,0 % | 17,2 % | 8,2 % | 0,0 % | 5,3 % | 6,8 % | 17 |
|
JR Smith |
61,5 % | 61,5 % | 19,9 % | 26,7 % | 7,8 % | 13,3 % | 3,1 % | 0,0 % | 8,8 % | 19 |
|
Speedy Claxton |
55,6 % | 70,9 % | 24,4 % | 46,2 % | 2,2 % | 0,0 % | 4,3 % | 2,6 % | 11,1 % | 24 |
|
Rasual Butler |
68,8 % | 68,8 % | 17,5 % | 10,0 % | 10,3 % | 0,0 % | 2,6 % | 3,2 % | 7,4 % | 15 |
|
Chris Andersen |
25,0 % | 25,0 % | 21,9 % | 0,0 % | 6,5 % | 0,0 % | 0,0 % | 7,9 % | 0,0 % | 1 |
|
Brandon Bass |
0,0 % | 0,0 % | 29,2 % | 0,0 % | 17,2 % | 0,0 % | 0,0 % | 0,0 % | -1,1 % | -1 |
Calculadas por Estadísticasdeportes a partir del box score (fórmulas v1). «—»: no significativo con tan pocos minutos.
Estadísticas básicas y avanzadas oficiales de NBA.com; avanzadas propias calculadas por Estadísticasdeportes.